The story
It began as a spreadsheet to keep every site, its metrics and our selling prices in one place — and grew into a dashboard that keeps itself current.
sites.xlsxedited 3 weeks ago
stale on arrival
Sites Panelupdated 4 min ago
live & watched
01 — The task
Keep every site in one place — and stop it going stale
We run a lot of sites and domains, and needed one home for all of them: the live metrics for each, and the price we sell an article or link on it for. The spreadsheet aged the moment we pasted into it — DR numbers went out of date, a site would go down and we’d hear it from a client, a domain would quietly expire. So we turned it into a living dashboard.
02 — What we built
One table where every domain is a self-updating row
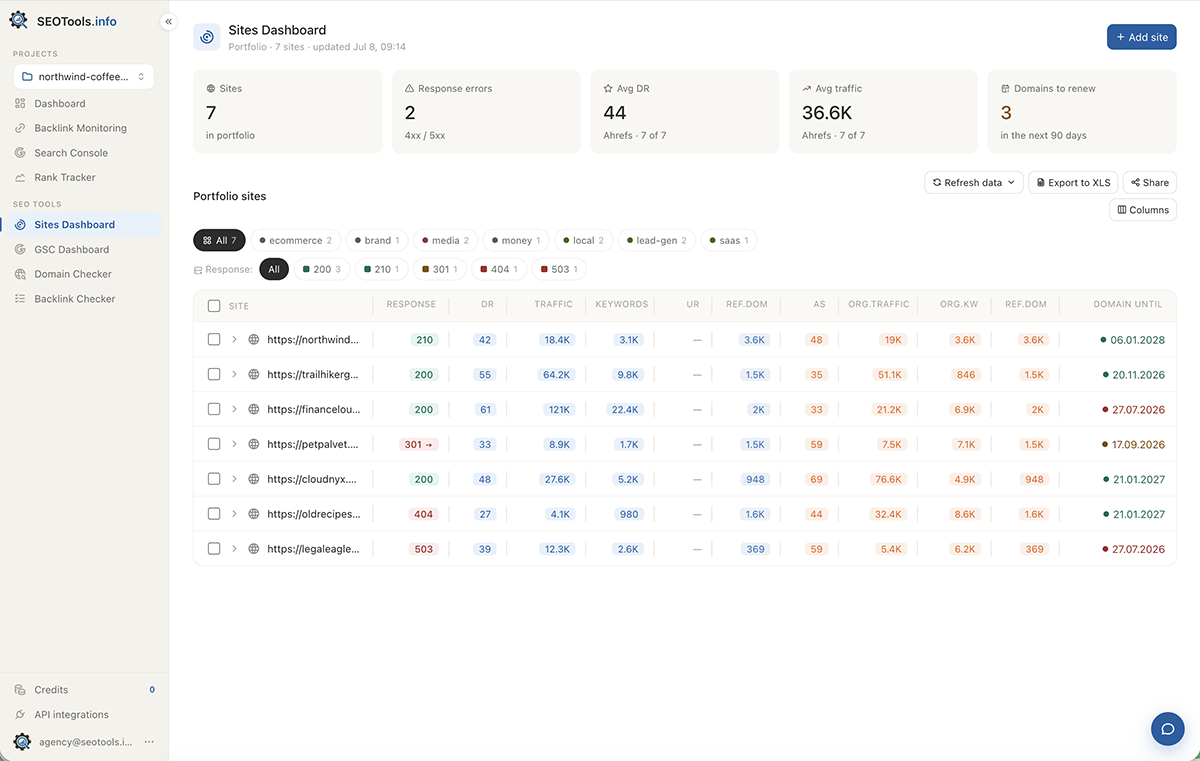
Each row fills itself in: scheduled HTTP checks with a green/amber/red status; WHOIS/RDAP expiry (ccTLDs too) with an early flag; Ahrefs DR, traffic, keywords and referring domains; real Google Analytics & Search Console per site; your own tags, custom columns and a price + currency. Underneath: background checks with one-click refresh, keys encrypted at rest, bulk import, full XLS export, team sharing with attribution, and instant in-browser sort/filter — plus daily snapshots that turn each number into a sparkline.
03 — What the report shows
The whole portfolio, and any one site up close
At a glance across every domain:
- Health now — who’s up, who’s 4xx/5xx, who quietly redirects
- Expiry — which domains lapse soon
- Authority — DR and real traffic, and where they trend down
- True Google numbers — GA & Search Console beside the estimates
- Your price — what you charge for placement, per site
- One site up close — response log, search clicks by month, trends
04 — How it helps
One screen instead of five tabs per site
You catch a 500, a DR drop or an expiring domain the day it happens — not after it costs you. When a buyer asks “how much for a link there?”, the price is already in the row, so you quote on the spot. And because daily snapshots accumulate, one-off numbers become a history you can actually read — the thing a spreadsheet never gave us.
How it’s built
Two levels of sites control: the portfolio and one site
Sites Panel control works on two levels. Land on one table with every domain you run — health, authority, expiry and your price, side by side. Open any row to drill into a single site’s response history, Google numbers and metric trends.
Level 1
Portfolio table
One row per domain: HTTP status, Ahrefs DR & traffic, keywords, domain expiry, tags and your price. Sort or filter by anything, refresh a row or the whole list, export to XLS.
All domainsSort & filterXLS export
Level 2
Site detail
Open a domain for response-error history, Search-Console clicks by month, Google Analytics and sparkline trends built from daily snapshots.
Response logSearch by monthTrends
Everything about a domain in one row
Each column answers a concrete question: what it shows, what you learn and how it helps.
HTTP health
Is the site answering right now
- Shows
- Response code, redirect target and last-checked time — a green / amber / red pill per site.
- You learn
- Which sites are up, which 4xx/5xx and which quietly redirect elsewhere.
- Helps
- Catch an outage the day it happens instead of from a client email.
200 · OK
RedirectnoneChecked4 min ago
Domain expiry
When each domain lapses
- Shows
- Expiry date from server-side WHOIS/RDAP — works for ccTLDs too — flagged when it’s close.
- Helps
- Never lose a ranking domain to a missed renewal.
clientshop.ioexp 22 days
blog-network.com2027-03-14
portfolio.dev2028-11-02
Ahrefs authority
DR, traffic, keywords, ref domains
- Shows
- Domain Rating, organic traffic, keyword count and referring domains — via the platform key or your own.
- Helps
- Rank your portfolio by strength and spot a DR drop early.
Analytics & Search
Real Google numbers per site
- Shows
- Google Analytics users/sessions and Search Console clicks by month, from real OAuth connections.
- Helps
- See true traffic next to third-party estimates — no tab-switching.
Search clicks · Jun12,480
Search clicks · May11,520
GA users · 28d38,900
Tags & filters
Slice the portfolio your way
- Shows
- Free-form tags per site plus instant sort/filter across every column.
- Helps
- Group by client, network or intent — “show only expiring PBN sites,” done.
#client#pbn#for-sale#expiring#guest-posts
Custom columns
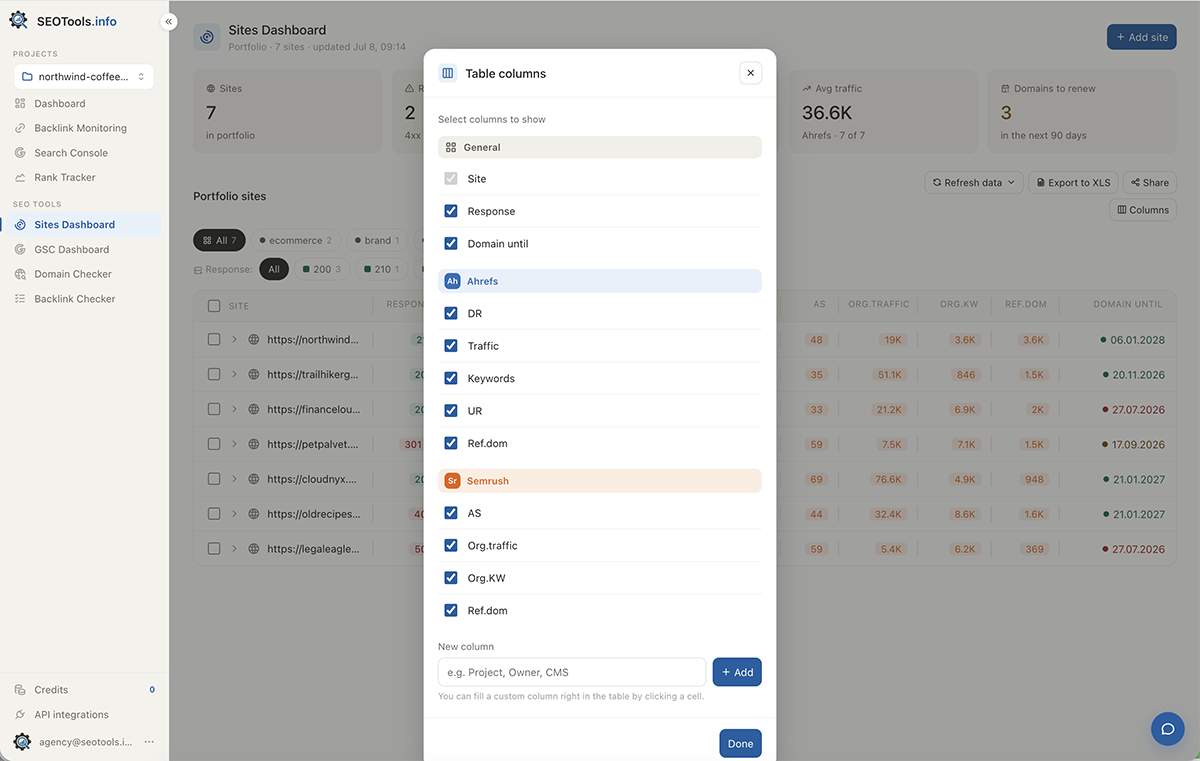
Your own fields, alongside ours
- Shows
- Add any column you track — owner, CMS, niche, account — stored per site.
- Helps
- Bend the table to your workflow instead of the other way round.
Owner · AnnCMS · WPNiche · finance
Price list
What you sell each site for
- Shows
- A per-site price and currency for a link or guest post.
- Helps
- Quote a buyer on the spot — the whole rate card lives in the same table.
blog-network.com$120
portfolio.dev€90
clientshop.io$250
Trends & refresh
Numbers over time, on demand
- Shows
- Sparklines built from daily snapshots, plus one-click re-check of HTTP, WHOIS and metrics.
- Helps
- Turn one-off numbers into a trend and refresh the moment you need fresh data.
What keeps the table live
A spreadsheet is stale the moment you paste into it. Sites Panel keeps itself current with background checks, your own API keys and a growing store of daily snapshots.
Background checks
HTTP status and WHOIS/RDAP expiry run on a schedule across the whole portfolio — with one-click manual refresh per row or in bulk.
Bring your own keys
Ahrefs, Google Analytics and Search Console connect with your own credentials (or the platform Ahrefs quota). Keys are encrypted at rest.
Metric warehouse
Daily snapshots of DR, traffic and search accumulate in your DB, so a flat number becomes a sparkline and a trend.
Import & export
Add domains in bulk from a pasted list and export the entire table — every column — to XLS.
Team & attribution
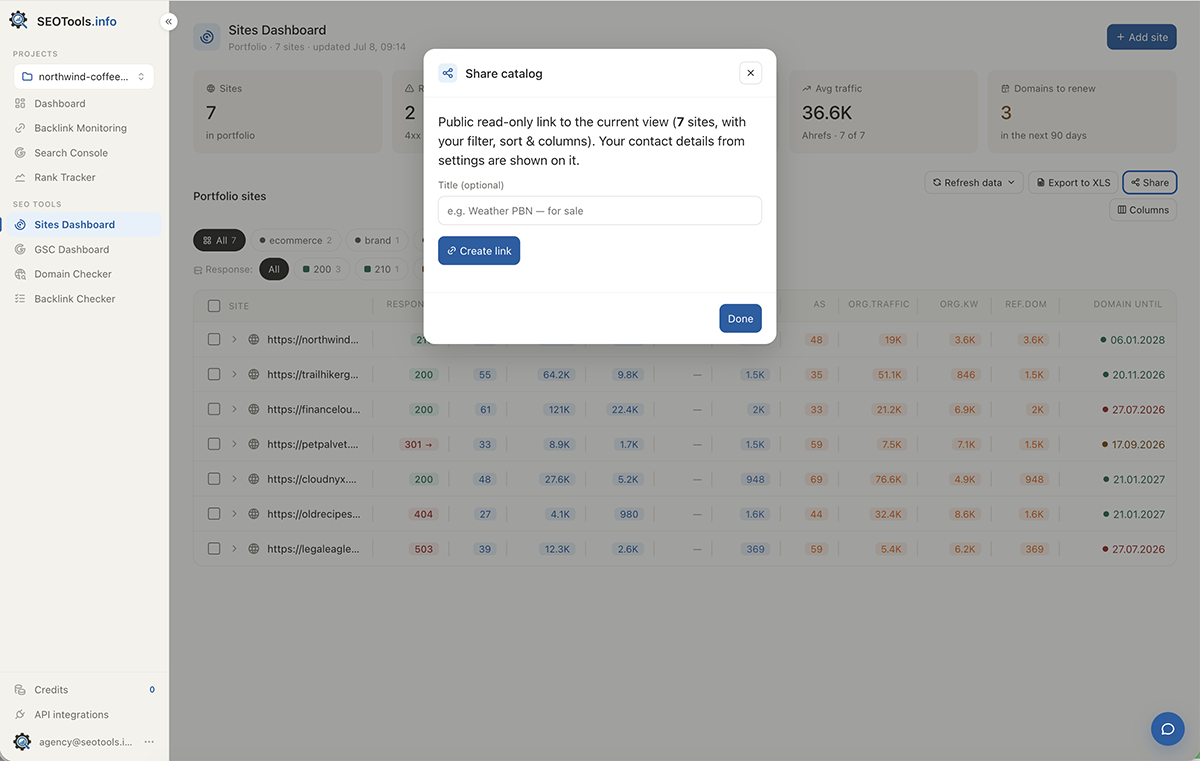
Share the portfolio with teammates; each row keeps a “user” so you know who added what. Viewers get read-only.
Sort & filter, instantly
Sorting and filtering happen in the browser across every column, so slicing hundreds of sites stays snappy.
Five reasons to keep it here
01
Live, not stale
Metrics and health refresh on their own. A spreadsheet is out of date the moment you finish pasting.
02
Everything in one row
DR, traffic, HTTP, expiry, GA, Search Console and your price — no five browser tabs per site.
03
Problems surface early
A 500, a DR drop, a domain expiring next month — each flagged the day it happens.
04
Your prices, ready to quote
Per-site link and guest-post rates live in the same table, so you answer a buyer in seconds.
05
History that accrues
Daily snapshots turn one-off numbers into trends you can actually read.
Honest caveats. Ahrefs, GA and Search Console need your own keys (or the platform Ahrefs quota); WHOIS expiry depends on the registrar exposing a date; and the Free plan caps the table at 10 sites — Pro and Agency are unlimited.